Are you looking for a quick way to compare similar foods for their nutrient value? Then check the % Daily Values on today’s Nutrition Facts labels.
The % Daily Values (% DVs) are the recommended amounts of certain nutrients that you should eat each day to stay healthy. These percentages are nutrient reference values of foods, and they show how foods fit into your overall daily diet.
Sample Label for Macaroni & Cheese
Nutrition Facts
Serving Size 1 cup (228g)
Servings Per Container 2
Amount Per Serving
Calories 250
Calories from Fat 110
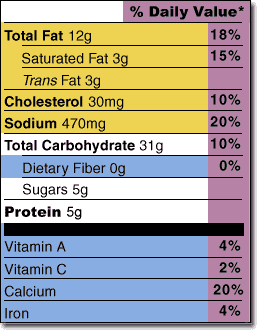
Note: The % DV column doesn’t add up vertically to 100%.
How to Use % Daily Value
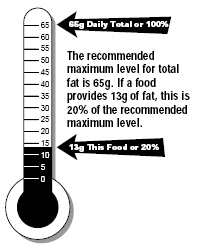
You do not need to know how to calculate percentages to use the % Daily Values, because the label does the math for you. It helps you interpret the numbers (written on the left in grams and milligrams) by putting them all on a 0-100% scale for the day. For example, the macaroni and cheese provides 12g of total fat, which is 18% of the daily maximum recommended amount of 65 grams, based on a 2,000 calorie diet.
Daily Value can be compared to a fundraising level. The % Daily Value is how much is given toward a recommended level by eating one serving of a food.
Let’s say that you ate two servings rather than one serving of the food in the example above. You consumed double the amount of fat, or 40% of the recommended maximum level for the entire day. That leaves you with 60% of your fat allowance from all the other foods you eat that day, including snacks and drinks.
You can still eat a healthy diet by using the % DV as a guide and making dietary trade-offs throughout the day. For example, balance a high-fat food (unhealthy saturated or trans fat) with low-fat foods at other times of the day. In other words, choose a food with a high % Daily Value of that nutrient and several foods with a low % Daily Value. (e.g. 11 grams of fat, 3 grams of fat, 0 grams of fat)
Each nutrient is based on 100% of the daily requirements for that nutrient in a 2,000 calorie diet. You may need more or less than that amount, depending on your age, gender, and activity level.
Even if you don’t know how many calories you consume in a day, you can still use the % Daily Value as a general guide. It doesn’t matter whether you consume more or less than 2,000 calories daily.
Quick Guide to % DV
These percentages show you whether the nutrients in a serving of food contribute a lot or a little to your daily intake. The fast way to determine which nutrients contribute a lot or a little to your daily recommended allowance is to use this guide:
- 5% DV or less of a nutrient is low
- 20% DV or more of a nutrient is high
Low % Daily Values: You should consume foods with 5% DV or less of these nutrients often:
- total fat*
- saturated fat
- cholesterol
- sodium
*Total fat includes all types of fat.
Limit these nutrients, because recommended amounts are the maximums you should consume. Aim for % Daily Values that add up to 100% or less of these nutrients each day.
High % Daily Values: Eat plenty of foods that contain 20% DV or more of these nutrients:
- carbohydrate
- dietary fiber
- vitamin A
- vitamin C
- calcium
- iron
Select foods totaling 100% or more of the Daily Values for these nutrients each day. Recommended amounts are the minimums you should consume.
Be aware that 100% Daily Value for some nutrients isn’t always the optimal amount for you. You may need more or less. For example, the % DV for calcium on food labels uses 1,000 milligrams for calculations. However, the Dietary Reference Intake (DRI) for calcium recommends an intake of 1,000 to 1,300 mgs per day, depending on gender and age.
Remember that you are aiming to reach 100% or more of the Daily Value for the vitamins and minerals in all the foods you eat. However, you should aim for 100% or less of the Daily Value for total fat, saturated fat, cholesterol and sodium.
Using % DV To Compare Foods
The % DV makes it easy for you to compare one product or brand to a similar product. Just make sure that you are comparing similar serving sizes or weights (e.g. gram, milligram, ounces). Since the serving sizes are generally consistent for similar types of foods, you easily can see which foods are higher or lower in nutrients. However, some cereals are an exception.
Nutrient Content Claims
Using the % DV, you quickly can distinguish one claim from another. For example, you don’t need to memorize definitions for nutrient claims such as “reduced fat,” “light,” “nonfat,” “low fat,” etc. To see which food product is lower or higher in a nutrient, just compare the % DV for Total Fat.
Reliable Nutrient Information
USDA’s Nutrient Data Laboratory: Want to know what nutrients are in your food? Find out in USDA’s Nutrient Data Laboratory, the nation’s primary source of food composition data. Get accurate information about fats, carbohydrates and protein, and learn what foods contain the most nutrients you are looking for in the foods you eat. This searchable database contains listings of over 7,000 foods in the National Nutrient Database for Standard Reference Release 18 (SR18).
http://www.ars.usda.gov/main/site_main.htm?modecode=12354500
For free downloads of this USDA National Nutrient Database for both Windows PC and Palm OS® Personal Digital Assistants (PDAs) go to: http://www.ars.usda.gov/Services/docs.htm?docid=5720 This site allows users to search and display nutrient content of thousands of foods, also.
Additional Web Sites:
http://www.ars.usda.gov/Services/docs.htm?docid=9673 provides the USDA Nutrients Lists of foods in alphabetical order as well as in descending order (high to low) by nutrient content. Source: Nutrient Data Laboratory, ARS, USDA.
http://www.ars.usda.gov/Services/docs.htm?docid=7783 is the What’s In The Foods You Eat Search Tool, a searchable database of nutrient content for 13,000 commonly eaten foods. Source: Food Surveys Research Group, ARS, USDA.
http://www.nal.usda.gov/fnic/foodcomp/Data/HG72/hg72_2002.pdf contains an online version of an old favorite, USDA Nutritive Value of Foods, Home and Garden Bulletin No. 72 PDF, revised in 2002. It provides tables of nutritive values for over 1,200 commonly eaten foods.
http://www.nal.usda.gov/fnic/foodcomp/search/ gives the nutrient value of thousands of foods. Results show values for 128 nutrients. Source: USDA National Nutrient Database. Nutrient Data Laboratory, ARS, USDA.
http://nat.crgq.com contains NATS Nutrition Analysis Tool, a software and database system that allows users to track calories, fats, carbohydrates, and overall nutritional intake to improve their diets and health. It is also available in a Palm OS® version for a small charge.
This program was developed in the Department of Food Science and Human Nutrition at the University of Illinois Urbana Champaign using USDA guidelines and product information from major food companies.
For more information on food labeling request: HGIC 4056, Reading the New Food Labels; HGIC 4058, Food Labels: Fat and Cholesterol; HGIC 4059, Food Labels: Carbohydrates; HGIC 4060, Serving Sizes for Special Diets; HGIC 4061, Nutrient Claims on Food Labels; and HGIC 4062, Nutrient Density.
Originally published 11/06